This post builds upon the dashboard we built in the last post. In particular we will:
- Simplify the dashboard flow using a Function node
- Alert the user when specific conditions are met
- Examine the source code for the final dashboard
Simplify Using Function Nodes
The previous version of the dashboard included three Change nodes...

The purpose of those nodes was to extract the temperature, humidity, and barometric pressure from the incoming JSON message. The reason we did that was because the Chart and Gauge nodes required that the payload hold only a single value, the value that will be charted.
The Function node will allow us to extract those three values in one step!
Start by adding a new Function node to the "MQTT Dashboard" workspace, name it "Extract Values", set the number of outputs to 3, and enter the following code for the Function node's umm... Function field:
return [
    {payload: msg.payload.temperature},
    {payload: msg.payload.humidity},
    {payload: msg.payload["barometric-pressure"]}
];
What this code does is to return an array of objects, each one of which contains a single property, "payload", which has been set to the temperature, humidity, and pressure found in the incoming message.
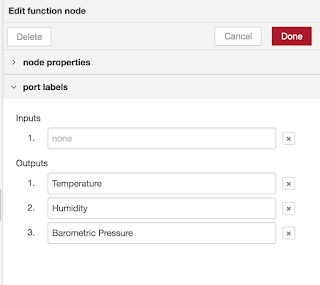
By giving the Function node three output ports, we are sending each value in that array out into those three ports. Which output goes to each port? The output ports will be arranged top to bottom on the right side of the node, with temperature going to the topmost port, humidity to the middle port, and pressure to the bottom. To make this easier to see, we can even give labels to the output ports, as shown:

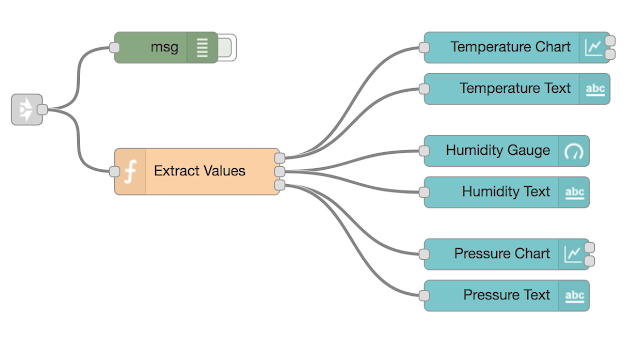
Now, remove the three Change nodes, drag the new Function node into place, and wire everything up like this:

Deploy the dashboard, view it at http://127.0.0.1:1880/ui, and it should be working fine!
Dashboard Notifications
Next, let us add some notifications within the dashboard. We want to alert the user when the temperature climbs above 80 °F. In particular, we will show a "toast" popup, and even use text-to-speech to announce that the temperature is above that value.
Now sensor readings are coming in once every second. So if we just did this, the user would be notified once every second - not a good user experience! What we must do is limit the rate that these notifications are sent, without changing the rate at which data is arriving. Node-RED has this functionality ready for our use, in Delay node, which is found in the "function" section of the palette.
Drag into the workspace one of each of the following nodes: Switch, Delay, Notification, Change, and Audio Out. The Notification and Audio Out nodes are found in the "dashboard" section. Set their properties as follows:
| Node Type | Property | Value |
|---|---|---|
| Name: | Check Temperature | |
| Property: | msg.payload | |
| Condition: | > 80 | |
| Action: | Rate Limit | |
| Rate: | 1 msg(s) per | |
| Interval: | 1 Minute | |
| Drop Intermediate Messages: | Checked | |
| Layout: | Top Right | |
| Timeout (S): | 3 | |
| Topic: | Temperature is Above 80 °F | |
| Action: | Set | |
| Object: | msg.payload | |
| To: | Temperature is above 80 degrees! | |
| Group: | Temperature [Living Room Data] | |
| TTS Voice: | Alex (en-US) |
Note that for the Notification node's topic, it is necessary to enter the degree (°) symbol directly - using the HTML escape sequence will not work!
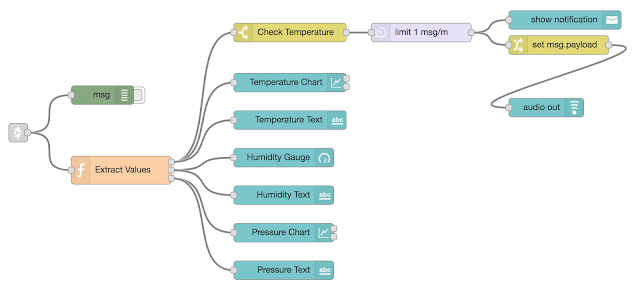
Finally, wire up components as follows:

An easy way to test this is to (believe it or not) breathe on the BME280. Once the temperature gets sufficiently high, the "toast" popup will be displayed in the top-right corner, and the audio message will be played!
Dashboard Source Code
Here's the source code for the dashboard flow. There are no changes to the MQTT Subscriber, and that code can be found in the previous post.
1 2 3 4 5 6 7 8 9 10 11 12 13 14 15 16 17 18 19 20 21 22 23 24 25 26 27 28 29 30 31 32 33 34 35 36 37 38 39 40 41 42 43 44 45 46 47 48 49 50 51 52 53 54 55 56 57 58 59 60 61 62 63 64 65 66 67 68 69 70 71 72 73 74 75 76 77 78 79 80 81 82 83 84 85 86 87 88 89 90 91 92 93 94 95 96 97 98 99 100 101 102 103 104 105 106 107 108 109 110 111 112 113 114 115 116 117 118 119 120 121 122 123 124 125 126 127 128 129 130 131 132 133 134 135 136 137 138 139 140 141 142 143 144 145 146 147 148 149 150 151 152 153 154 155 156 157 158 159 160 161 162 163 164 165 166 167 168 169 170 171 172 173 174 175 176 177 178 179 180 181 182 183 184 185 186 187 188 189 190 191 192 193 194 195 196 197 198 199 200 201 202 203 204 205 206 207 208 209 210 211 212 213 214 215 216 217 218 219 220 221 222 223 224 225 226 227 228 229 230 231 232 233 234 235 236 237 238 239 240 241 242 243 244 245 246 247 248 249 250 251 252 253 254 255 256 257 258 259 260 261 262 263 264 265 266 267 268 269 270 271 272 273 274 275 276 277 278 279 280 281 282 283 284 285 286 287 288 289 290 291 292 293 294 295 296 297 298 299 300 301 302 303 304 305 306 307 308 309 310 311 312 313 314 315 316 317 318 319 320 321 322 323 324 325 326 327 328 329 330 331 332 333 334 335 336 337 338 339 340 341 342 343 344 345 346 347 348 349 350 351 352 353 354 355 356 357 358 359 360 361 | [
{
"id": "492fdf69.9cb38",
"type": "link in",
"z": "49d20fae.01266",
"name": "From Subscriber",
"links": [
"3a476f0b.d6bea"
],
"x": 195,
"y": 220,
"wires": [
[
"14f7f237.a4b53e",
"cf06c435.a31528"
]
]
},
{
"id": "14f7f237.a4b53e",
"type": "debug",
"z": "49d20fae.01266",
"name": "",
"active": false,
"console": "false",
"complete": "true",
"x": 330,
"y": 160,
"wires": []
},
{
"id": "6b80f3f4.1fdb4c",
"type": "ui_gauge",
"z": "49d20fae.01266",
"name": "Humidity Gauge",
"group": "f468b186.a264b",
"order": 0,
"width": 0,
"height": 0,
"gtype": "gage",
"title": "",
"label": "%",
"format": "{{value}}",
"min": 0,
"max": "100",
"colors": [
"#00b500",
"#e6e600",
"#ca3838"
],
"seg1": "",
"seg2": "",
"x": 620,
"y": 260,
"wires": []
},
{
"id": "62dd2ada.5449a4",
"type": "ui_chart",
"z": "49d20fae.01266",
"name": "Temperature Chart",
"group": "637855dc.2229bc",
"order": 0,
"width": 0,
"height": 0,
"label": "",
"chartType": "line",
"legend": "false",
"xformat": "HH:mm:ss",
"interpolate": "linear",
"nodata": "",
"dot": false,
"ymin": "",
"ymax": "",
"removeOlder": "5",
"removeOlderPoints": "",
"removeOlderUnit": "60",
"cutout": 0,
"useOneColor": false,
"colors": [
"#1f77b4",
"#aec7e8",
"#ff7f0e",
"#2ca02c",
"#98df8a",
"#d62728",
"#ff9896",
"#9467bd",
"#c5b0d5"
],
"useOldStyle": false,
"x": 630,
"y": 140,
"wires": [
[],
[]
]
},
{
"id": "4075ff77.21db8",
"type": "ui_chart",
"z": "49d20fae.01266",
"name": "Pressure Chart",
"group": "9728196c.705ff8",
"order": 0,
"width": 0,
"height": 0,
"label": "",
"chartType": "line",
"legend": "false",
"xformat": "HH:mm:ss",
"interpolate": "linear",
"nodata": "",
"dot": false,
"ymin": "",
"ymax": "",
"removeOlder": "5",
"removeOlderPoints": "",
"removeOlderUnit": "60",
"cutout": 0,
"useOneColor": false,
"colors": [
"#1f77b4",
"#aec7e8",
"#ff7f0e",
"#2ca02c",
"#98df8a",
"#d62728",
"#ff9896",
"#9467bd",
"#c5b0d5"
],
"useOldStyle": false,
"x": 620,
"y": 380,
"wires": [
[],
[]
]
},
{
"id": "df80eb36.2bf648",
"type": "ui_text",
"z": "49d20fae.01266",
"group": "637855dc.2229bc",
"order": 0,
"width": 0,
"height": 0,
"name": "Temperature Text",
"label": "Temperature: ",
"format": "{{msg.payload}} °F",
"layout": "row-left",
"x": 630,
"y": 200,
"wires": []
},
{
"id": "51d9d859.dc84c8",
"type": "ui_text",
"z": "49d20fae.01266",
"group": "f468b186.a264b",
"order": 0,
"width": 0,
"height": 0,
"name": "Humidity Text",
"label": "Humidity: ",
"format": "{{msg.payload}} %",
"layout": "row-left",
"x": 620,
"y": 320,
"wires": []
},
{
"id": "919809c4.84ef18",
"type": "ui_text",
"z": "49d20fae.01266",
"group": "9728196c.705ff8",
"order": 0,
"width": 0,
"height": 0,
"name": "Pressure Text",
"label": "Barometric Pressure:",
"format": "{{msg.payload}} InHg",
"layout": "row-left",
"x": 620,
"y": 440,
"wires": []
},
{
"id": "d29db2b5.f8ddb",
"type": "delay",
"z": "49d20fae.01266",
"name": "",
"pauseType": "rate",
"timeout": "5",
"timeoutUnits": "seconds",
"rate": "1",
"nbRateUnits": "1",
"rateUnits": "minute",
"randomFirst": "1",
"randomLast": "5",
"randomUnits": "seconds",
"drop": true,
"x": 840,
"y": 60,
"wires": [
[
"6e7140a1.07b05",
"1e27bbe.febf544"
]
]
},
{
"id": "6e7140a1.07b05",
"type": "ui_toast",
"z": "49d20fae.01266",
"position": "top right",
"displayTime": "3",
"highlight": "",
"outputs": 0,
"ok": "OK",
"cancel": "",
"topic": "Temperature is Above 80 °F",
"name": "",
"x": 1070,
"y": 40,
"wires": []
},
{
"id": "bb4a13de.4faaa",
"type": "switch",
"z": "49d20fae.01266",
"name": "Check Temperature",
"property": "payload",
"propertyType": "msg",
"rules": [
{
"t": "gt",
"v": "80",
"vt": "num"
}
],
"checkall": "true",
"outputs": 1,
"x": 630,
"y": 60,
"wires": [
[
"d29db2b5.f8ddb"
]
]
},
{
"id": "3f251d1e.167872",
"type": "ui_audio",
"z": "49d20fae.01266",
"name": "",
"group": "637855dc.2229bc",
"voice": "en-US",
"always": false,
"x": 1040,
"y": 180,
"wires": []
},
{
"id": "1e27bbe.febf544",
"type": "change",
"z": "49d20fae.01266",
"name": "",
"rules": [
{
"t": "set",
"p": "payload",
"pt": "msg",
"to": "Temperature is above 80 degrees!",
"tot": "str"
}
],
"action": "",
"property": "",
"from": "",
"to": "",
"reg": false,
"x": 1060,
"y": 80,
"wires": [
[
"3f251d1e.167872"
]
]
},
{
"id": "cf06c435.a31528",
"type": "function",
"z": "49d20fae.01266",
"name": "Extract Values",
"func": "return [\n {payload:msg.payload.temperature}, \n {payload:msg.payload.humidity},\n {payload:msg.payload[\"barometric-pressure\"]}\n];",
"outputs": "3",
"noerr": 0,
"x": 360,
"y": 280,
"wires": [
[
"bb4a13de.4faaa",
"62dd2ada.5449a4",
"df80eb36.2bf648"
],
[
"6b80f3f4.1fdb4c",
"51d9d859.dc84c8"
],
[
"4075ff77.21db8",
"919809c4.84ef18"
]
],
"outputLabels": [
"Temperature",
"Humidity",
"Barometric Pressure"
]
},
{
"id": "f468b186.a264b",
"type": "ui_group",
"z": "",
"name": "Humidity",
"tab": "d376d602.4e3538",
"order": 2,
"disp": true,
"width": "6"
},
{
"id": "637855dc.2229bc",
"type": "ui_group",
"z": "",
"name": "Temperature",
"tab": "d376d602.4e3538",
"order": 1,
"disp": true,
"width": "6"
},
{
"id": "9728196c.705ff8",
"type": "ui_group",
"z": "",
"name": "Barometric Pressure",
"tab": "d376d602.4e3538",
"order": 3,
"disp": true,
"width": "6"
},
{
"id": "d376d602.4e3538",
"type": "ui_tab",
"z": "",
"name": "Living Room Data",
"icon": "dashboard",
"order": 2
}
]
|
